
Hong Kong·China
 Monday to Friday: 9am to 6pm
Breakout is the most commonly used trading strategy. Any section of the market we can be regarded as a breakthrough. The interval into the trend needs the boundary breakthrough,
the trend is just the continuous breakthrough of the band.
If you quickly master the breakthrough trading skills? We believe that the flexible use of classical graphics patterns is an effective method.
Breakthrough strategy 1: head and shoulder shape trend reversal
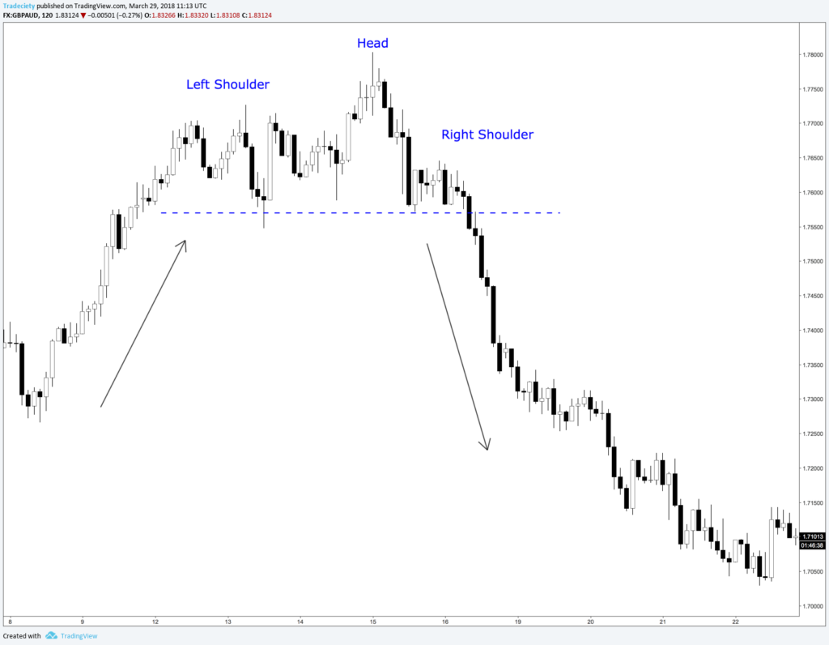
The left shoulder we can see the price form a high, the top price forming a new high, the right shoulder is not a new high,
the key support resistance is the neck position, the price below it large probability trend reversal. The neck line of the head and shoulder shape is not the standard horizontal level, but can also be an oblique line, connecting the band points.

Breakthrough strategy 2: the head and shoulder shape trend continues
The head and shoulder pattern is not only a reversal pattern, but also an expression of the continuation of the trend.

Breakthrough strategy three: wedge form breakthrough
A wedge is a graphical pattern formed based on a trend line. As shown in the figure below, we can see that the slope of the upper trend line is constantly decreasing,
while the slope of the lower trend line remains unchanged, indicating that the upward momentum is declining and the trend is weakening. When the price falls below the previous low of position X, there is a high probability that the trend will reverse.

Breakthrough strategy four: a three-top-type breakthrough
Three-top form as we said in the previous article, the win rate is higher than the double top. Prices have been repeatedly tested in a narrow range, indicating that this position has a strong support resistance effect. Once you break through this form boundary, it is often a strong trend market

Breakthrough strategy five: triangle form breakthrough

When the long-air forces are extreme balance, it is the precursor of breakthrough. As the spring is constantly compressed, the rebound force will continue to strengthen. We believe that triangles work better than wedge breakthroughs. In addition, there are varieties of cup handle shape, small rebound, secondary test and other forms.
Cup handle shape breakthrough:

A small rebound:

A small rebound is an important trading skill. As shown in the price above, the green support level was tested for many times without breaking,
and finally rebounded slightly at the red line, indicating that the rebound is weak and is also a precursor to the support breakthrough. This form can be seen in the above several patterns.
Secondary test:

On the left, the head and shoulder morphology trend continues. After the price breaks the neck position, most cases will be back to test the effectiveness of the neck position. Conservative traders can enter at the box. Graphaph form is the K-line expression of long-short price game. Trading breakout, we should focus on near the key support resistance level, looking for a small rebound, a second test approach signal.
Risk warning:All indicators and automatic transactions of the company EA were deciphered and developed by the technical and alliance technical team of Fusheng Investment Management Group, and sold online. These tools are only used to assist in making transaction decisions, rather than to advise or guide users to make any investment decisions. We do not guarantee any profit or any investment advice when using the products purchased with the Company.
The risk of trading and using any products or recommendations of the Company is at the expense of the user.Financial derivatives investment has certain risks, which is not applicable to all investors.
Please make a good risk prediction and evaluation on their own experience and investment ability
Investment is risky, and entering the market needs to be cautious.

2023-11-04

2023-10-09
Taihe Asset Management Company's main businesses include securities investment, foreign exchange investment, equity investment, entrusted asset management, fund investment and management, with businesses throughout the world. Due to unpredictable fluctuations in the value and price of related financial instruments or products, such investments may bring high risks, and the resulting losses may exceed your initial investment. Please be sure to fully understand the transaction risks of corresponding financial instruments or products.